In the latest releases of OSLC Connect for Jira (4.1 and 5.1), there is a new option to download the TRS feed. We created this feature when collaborating with some customers on the load profile of their OSLC Enterprise. While doing so, we felt it would be valuable to show how this information can help you understand your Jira system better.
Basics on TRS
Tracked Resource Sets (TRS) are a way to allow a remote system to track artifacts. It provides the base list of artifacts to be monitored and a change log. The change log is a rolling list of changes for up to 7 days, including Creation, Modification, and Deletion events.
The TRS interface is a REST API that returns XML pages listing elements. In the case of the change log, it also lists the associated event for each component. It is then up to the remote application to read the resources to keep its internal stores up to date.
What we can analyze
TRS does provide a valuable snapshot into the activities of a Jira system. We can observe change rates and change loads. This should allow an enterprise to understand the actions in their Jira system, as well as their impact on the IBM enterprise. It can also help detect suprises, like automations gone a little crazy and modifiying on object over and over again.
Sample Analysis Script
Our analysis script is a simple Python script that takes an OSLC Connect downloaded TRS Archive and provides a summary of events and event rates, as well as a basic plot. We encourage administrators to use these tools to understand TRS and their own enterprise better. Our scripts are not supported features of the product, but rather examples to help you explore and build a deeper understanding.
Example Results
So let’s look at some example results.
Executing the script is relatively simple.
python trsAnalysis.py TrsFeed_cm_2025-04-21T17_17_52.zip
Textually, it will provide a set of responses
-
The size of the base members (basic monitoring size) and changes (events over the last 7 days)
-
A summary of hourly events to see how heavy or steady the change events are occuring
-
A list of the most often changed artifacts to observe if there is an unnatural number of changes happening on items
-
And an outline of the total number of differnet types of events (Modification, Creation, and Deletion)
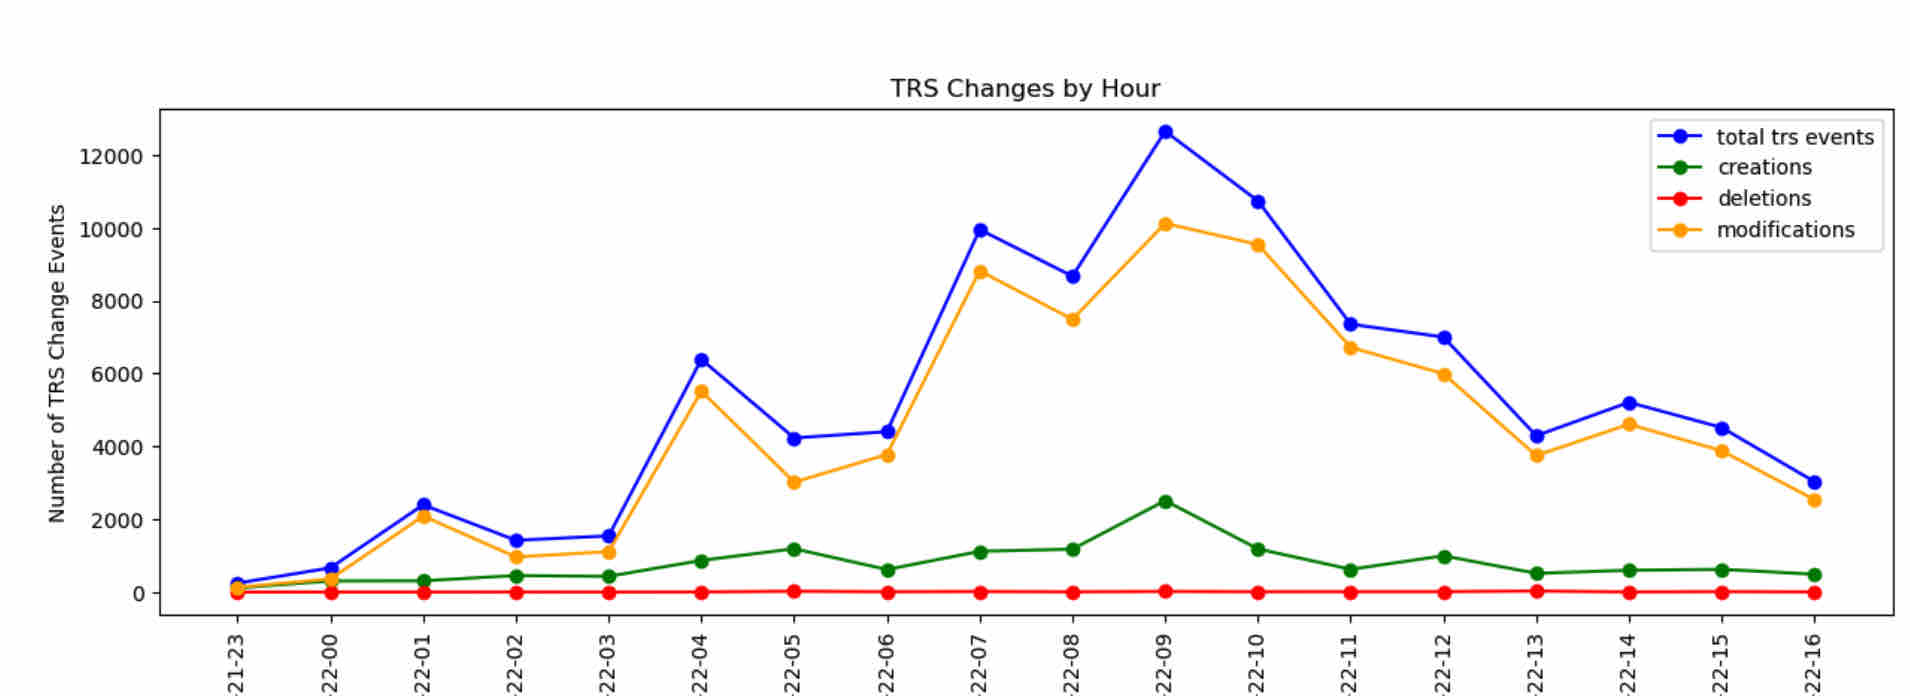
In addition, you will have a plot generated that will show the changes over a period of time.
For example ->
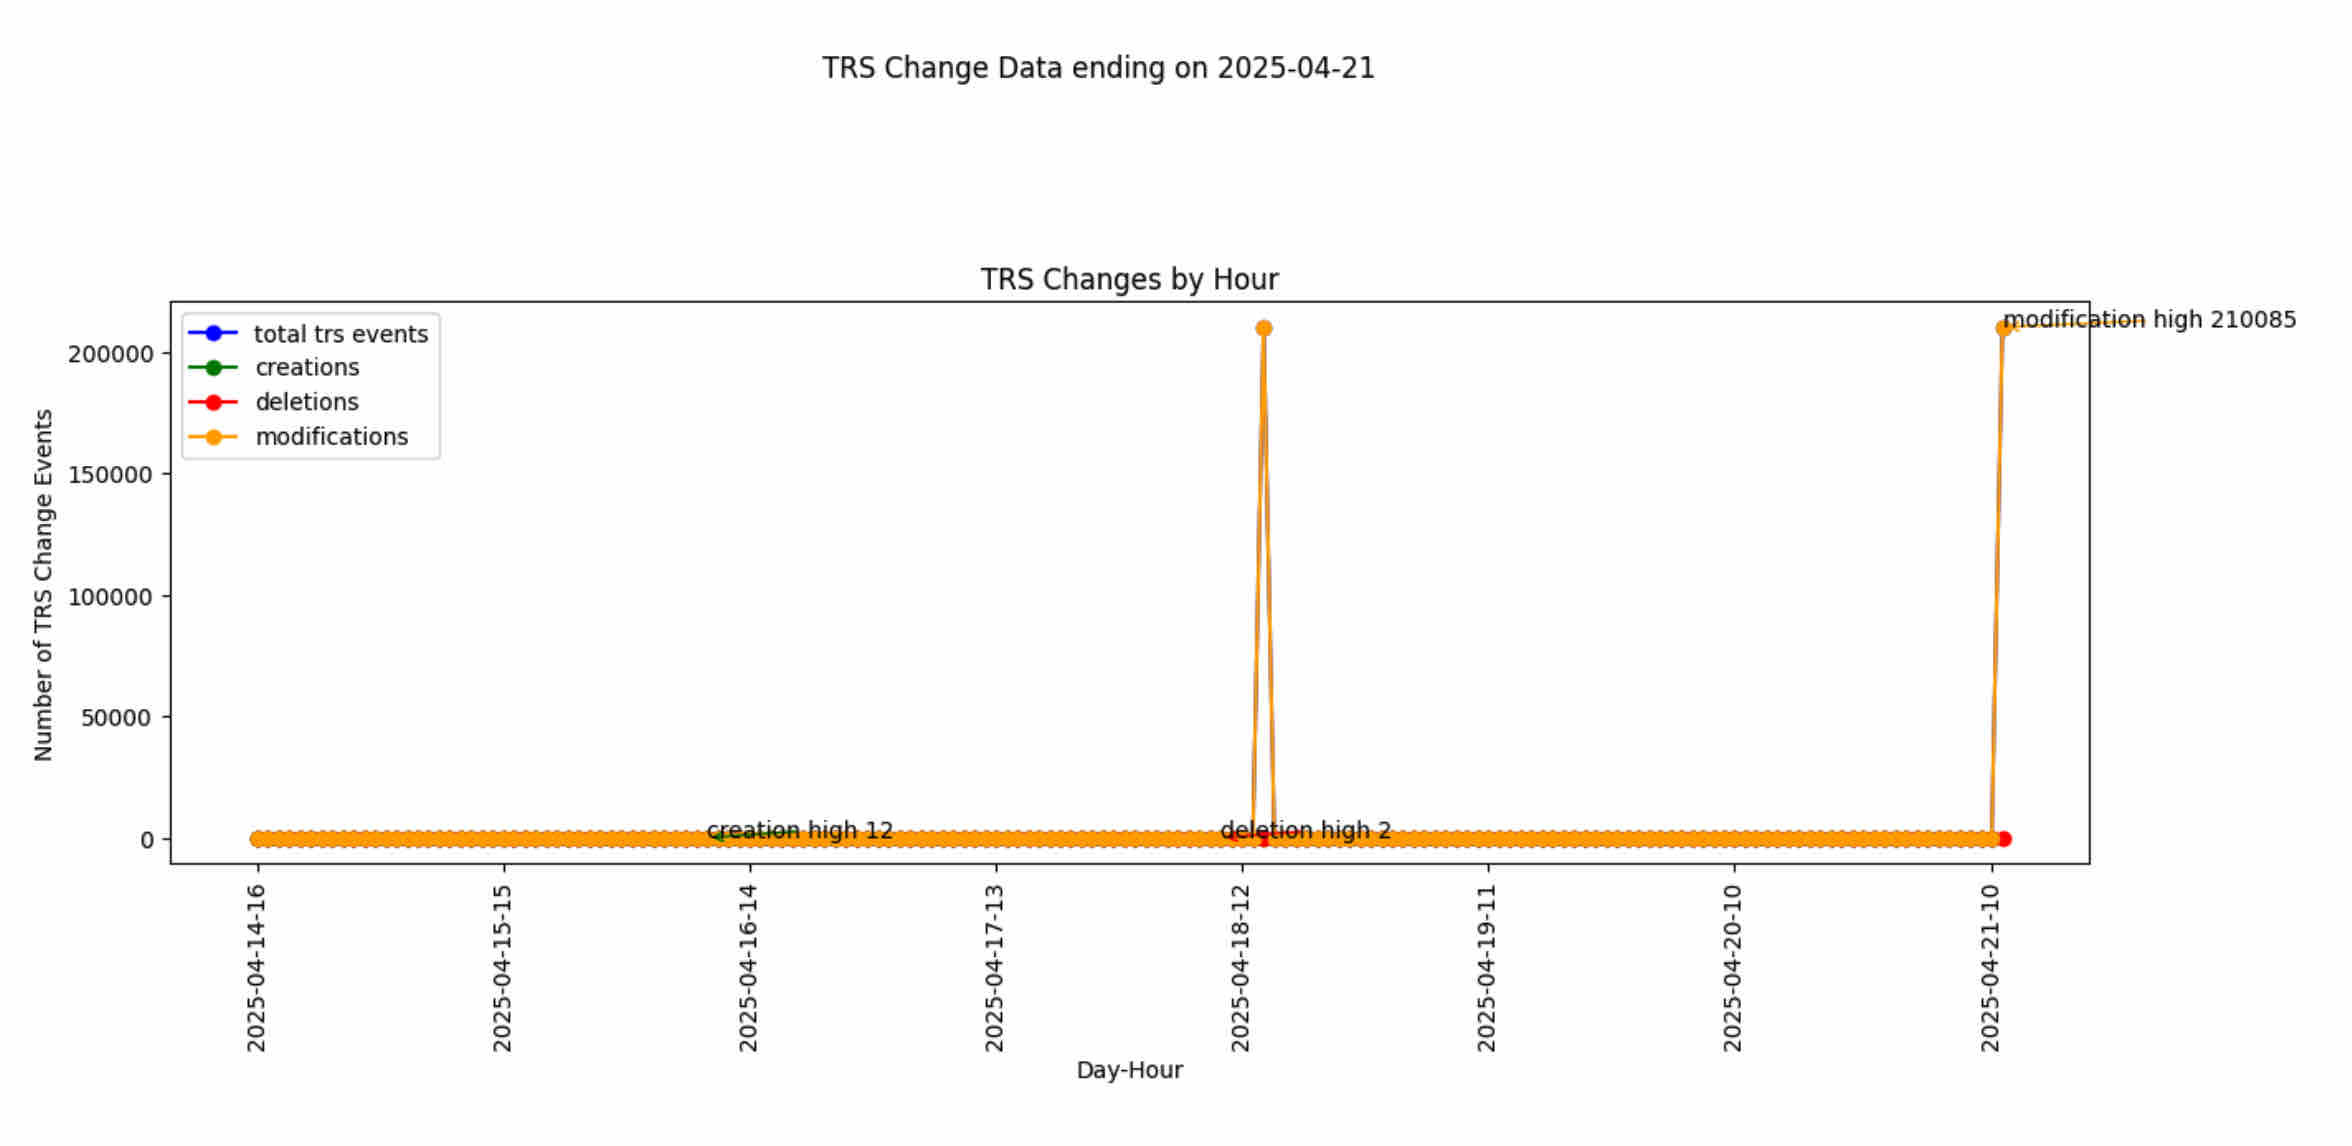
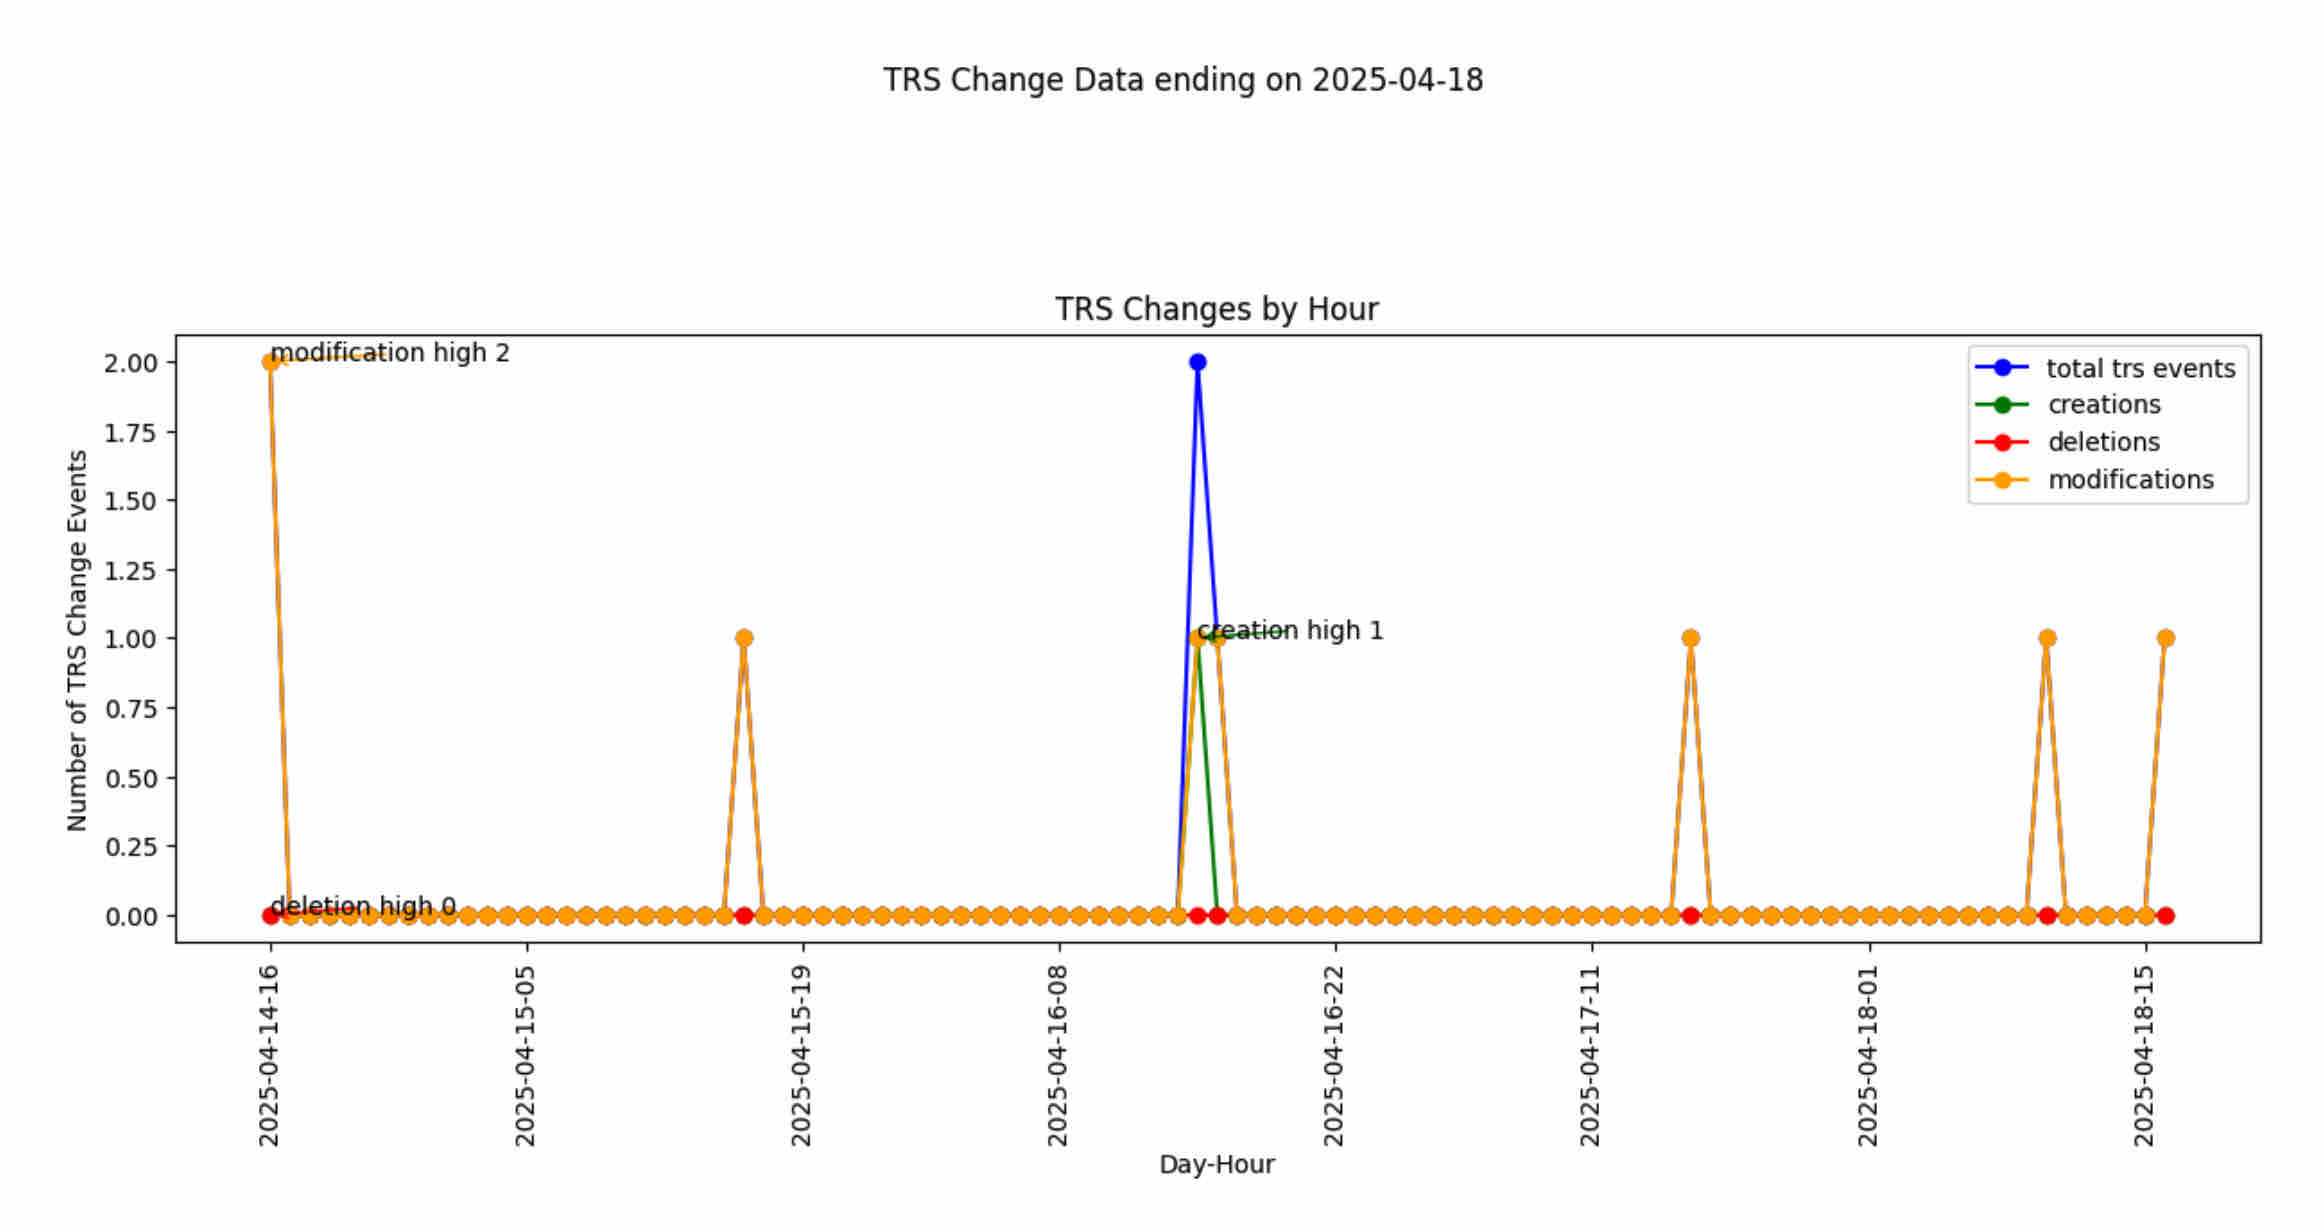
Or in more active systems, you may see a shorter duration with more active hourly events.
And when we looking at TRS feeds for process (projects) we usually see a much calmer and smaller set of changes. Note also that with the process feed, we see a natural rhythm around 1600, which relates to the daily repair event when we publish project changes.
Sample Python Code
Here is the sample Python code to review, tune, and improve.