When troubleshooting complex issues, it is sometimes necessary for our support team to obtain additional information about the network requests that are generated in your browser while an issue occurs. Using developer tools to inspect a web page allows us to:
-
Identify the errors and warnings reporting by a web page on loading
-
Identify the network traffic and inspect details of failing requests
The advantage here is that the user can examine the issue and retrieve error messages without the need of an Administrator.
Accessing the Developer Tools
For most web browsers to access Developer Tools, right-click on the web page, then select Inspect or Inspect Element. Otherwise access the tool from the Browser menu:
|
Browser Name |
Access from the Menu |
|---|---|
|
Google Chrome |
More Tools > Developer Tools |
|
Mozilla Firefox |
Tools > Web Developer > Inspector |
|
Internet Explorer |
F12 (Or, go to the Tools menu using press Alt+X and select Developer Tools.) |
|
Safari |
Develop menu, then select Show Web Inspector |
Using the tool
Console and Network are the two tabs that are of most interest.
The Network Tab gives us a view of the resources that are requested and downloaded over the network in real-time.
Choose "Network" tab
-
Refresh the page you're on with F5 or else be sure to open the tab before loading a page so that it captures the network requests
-
You'll get a list of HTTP queries that happened
-
Select one of the names in the left-hand column
-
The "Headers" tab shows the request and response headers.
-
Right-click on the Name column of interest and check for error codes
-
Save the HAR (HTTP Archive) file will depend on the browser being used. See the Table below.
-
Attach the file to the Jira Portal ticket.
|
Browser Name |
To generate the HAR file
|
|---|---|
|
Google Chrome |
right-click anywhere on the grid of network requests, select Save as HAR with Content, and save the file to your computer. |
|
Mozilla Firefox |
right-click anywhere under the File column and click on Save all as Har. |
|
Internet Explorer |
Click the Save button.
|
|
Safari |
Click the Export icon on the far right of the network tab and save the HAR file. |
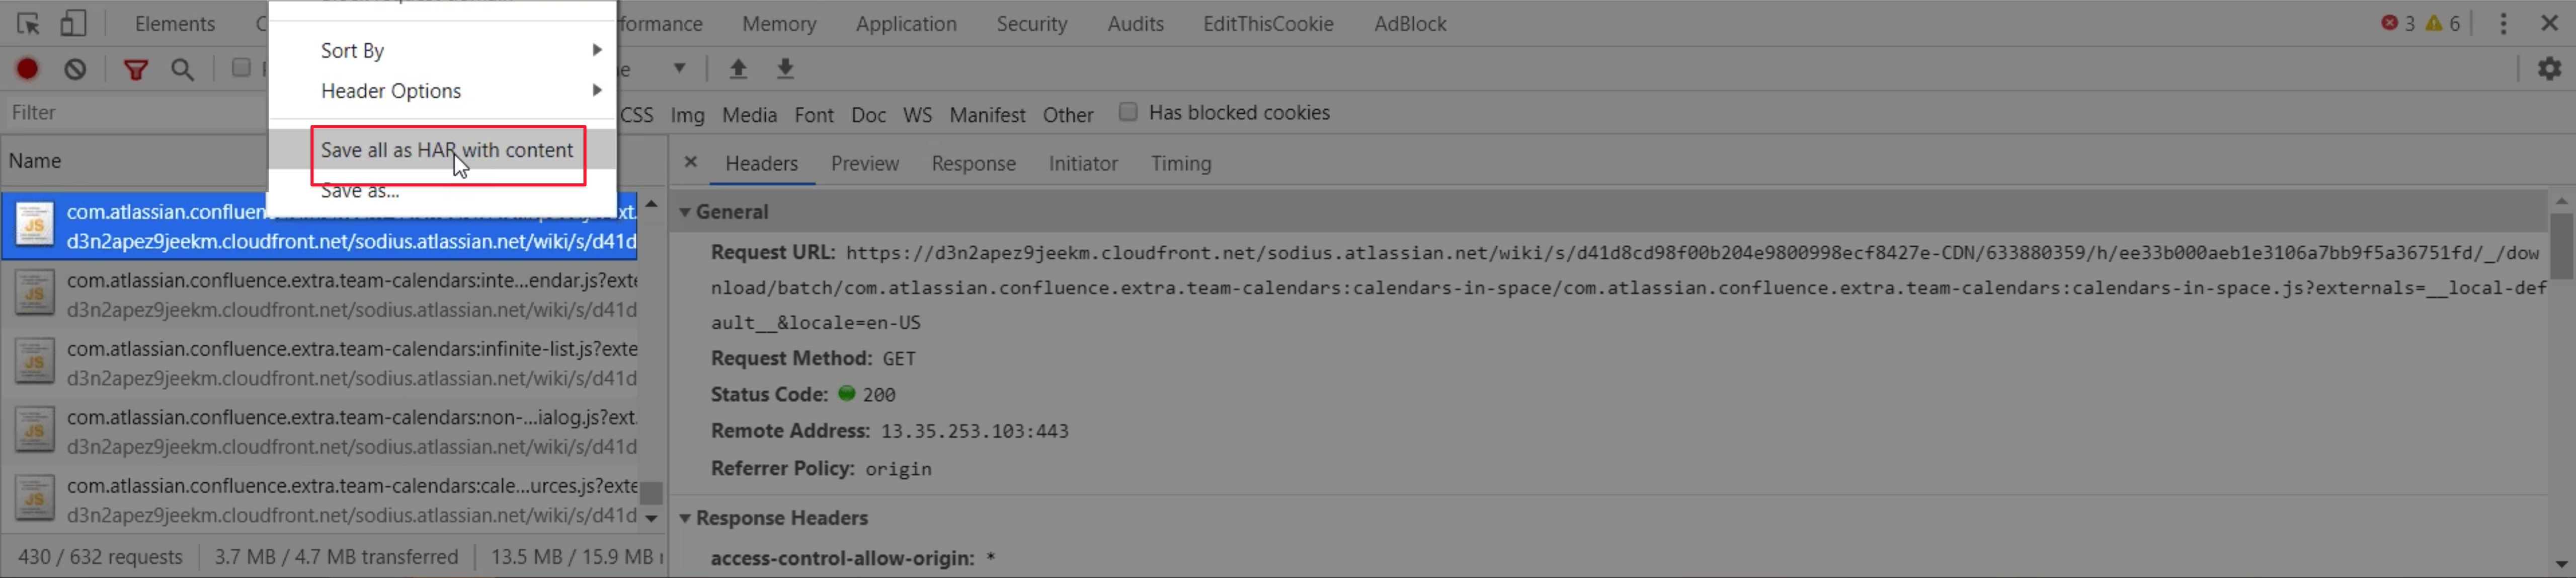
Example for Google Chrome
We are looking for an HTTP status code returned by the server.
A 200 code is common for a successful response; although anything within the range of 200-299 is considered OK. Error codes like HTTP response code 401 or 500 are shown in red.
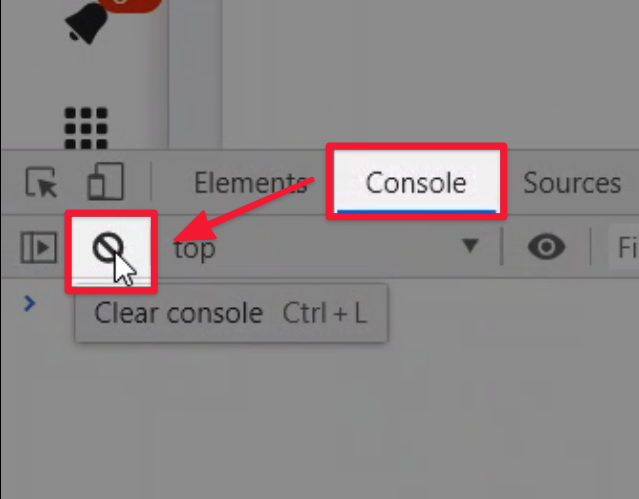
The Console tab
The Console has 2 main uses: viewing logged messages and running JavaScript. We’re interested in logged error and warning messages especially any error codes that are shown.
Steps to perform
-
Show the Console and look for Error warnings.
-
Take a screenshot or copy the error(s)
-
Clear the console as shown below.
-
Refresh the web page, and then perform the steps that led to the issue.
-
Copy the content or right-click “Save as” and attach the file(s) to the Jira Portal ticket.